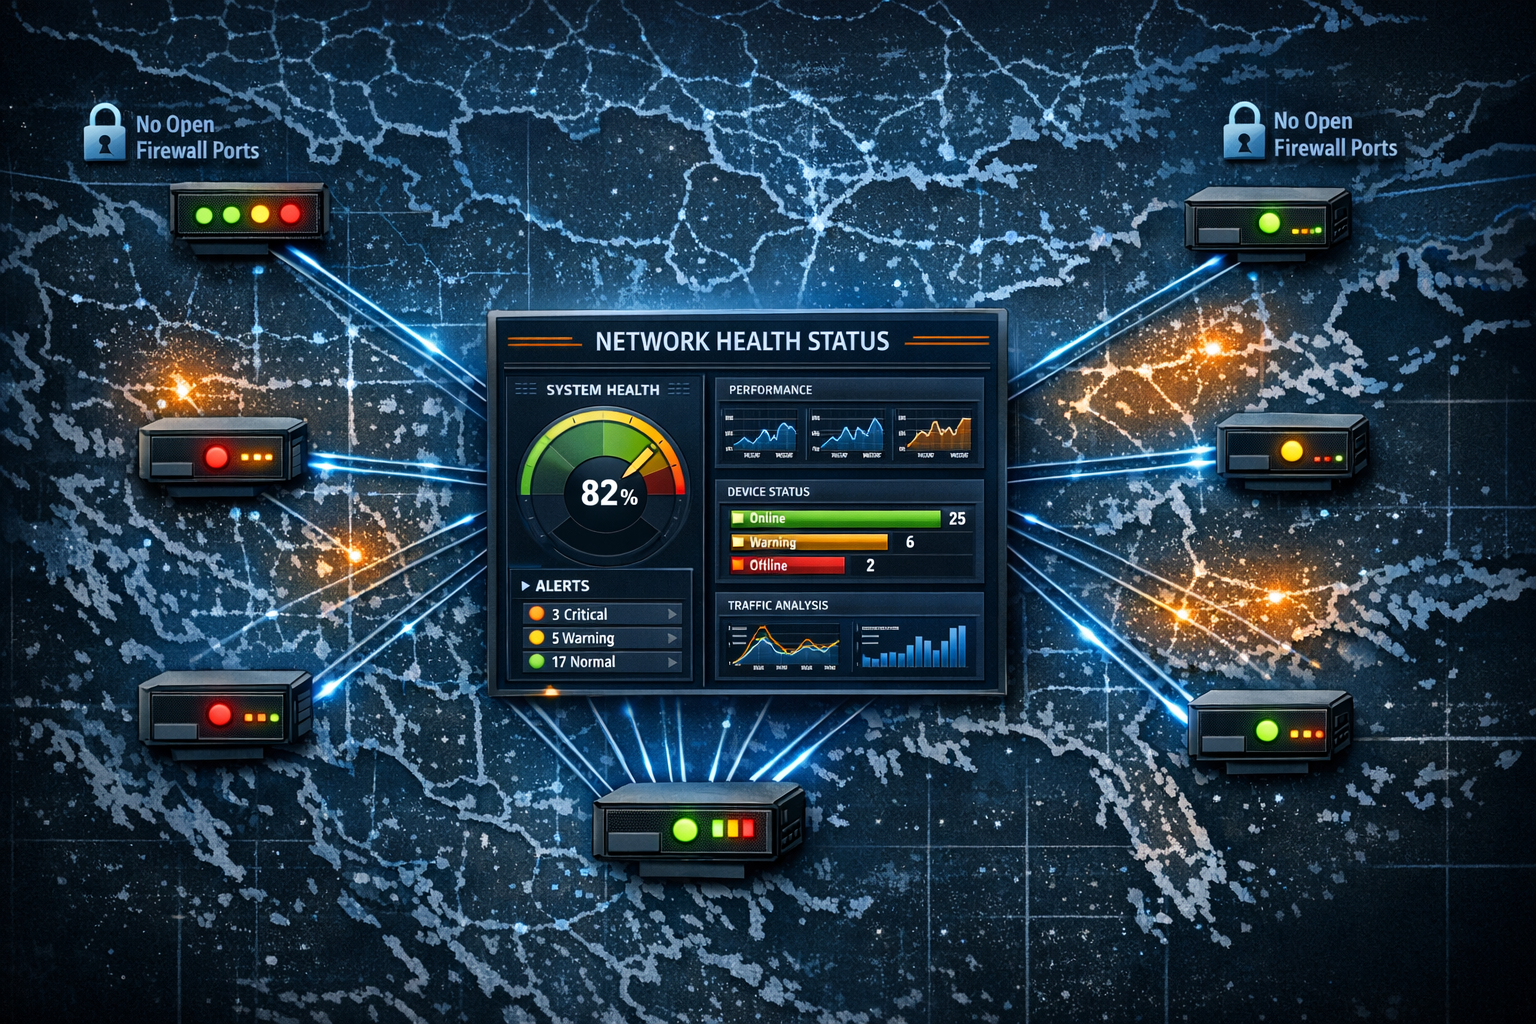
Edge devices generate data. Sensor readings, system metrics, error logs, status reports. Monitoring systems need to collect this data to detect problems before they escalate. The challenge is that edge devices typically sit behind firewalls, on networks where opening inbound ports for a monitoring agent is not practical or permitted.
Active Polling Through the Tunnel
ProxyPass solves the connectivity problem without touching the firewall. A node on the same network as the edge devices provides tunnel access. Your monitoring system reaches the devices through the REST Bridge, querying local HTTP APIs for health data, metrics, or status endpoints.
This works with any monitoring approach:
- Poll a device's health-check endpoint every 60 seconds
- Pull metrics from a Prometheus exporter running on an edge device
- Query a local API that reports sensor readings, battery levels, or error counts
Whatever the device exposes over HTTP locally, you can reach it through ProxyPass.
Scenario: Nationwide Energy Monitoring
An energy company monitors solar inverters and battery systems at 120 commercial installations across the country. Each site has equipment that exposes status data through local HTTP APIs — current power output, battery state of charge, error codes.
They deploy a ProxyPass node at each site. Their central monitoring system polls each inverter's API through the REST Bridge every 60 seconds. The data feeds into Grafana dashboards that show real-time performance across all 120 sites.
When an inverter at Site #47 reports an error code, the monitoring system creates an alert. The operations team uses CONNECT mode to SSH into the site controller and check detailed diagnostic logs. They identify a firmware issue, upload a patched firmware via File Mount, and trigger a remote restart. The issue is resolved without sending a technician to the site.
Passive Monitoring With Webhooks
Webhooks add a passive monitoring layer on top. When a node goes offline, your monitoring system is notified immediately (with debounce to filter transient disconnects). You do not need to wait for a polling cycle to detect that a site is down.
The combination of active polling (through REST Bridge or CONNECT) and passive notification (through webhooks) gives you full observability of your edge infrastructure — without opening a single port on any remote network.